

Most market-leading performance testing tools (LoadRunner, JMeter, Azure DevOps, NeoLoad, WebLOAD, etc.) provide server response time when conducting different types of tests such as load, stress, spike, and endurance. However, it is also essential for software testers to figure out the page load time while performing load testing. In this blog post, we will find out how to measure page load time with Selenium and JMeter for automated cross-browser testing. Before we get started, let’s understand the relevance of page load time for a website/web application.
Capturing Page Load Time
For software testers, it is important to find out the overall page load time during load testing because even though server response might be good, there could be an issue with certain UI elements. For instance, an image could take additional time to load, in such a scenario the need to compress image size is ideally not a server-side issue. Faster results can only be achieved by integrating JMeter with Selenium.

How JMeter Can Get Selenium Components?
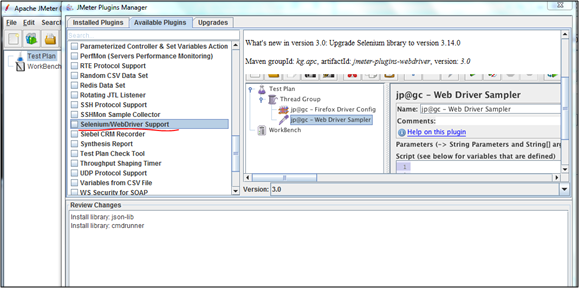
JMeter provides plugins for Selenium components which can be downloaded from JMeter Plugins Manager. When we install the Selenium WebDriver support plugin from the plugin manager (as shown below) the required jar file will store in JMeter lib/ext folder of the tool.
Creating Selenium Scripts
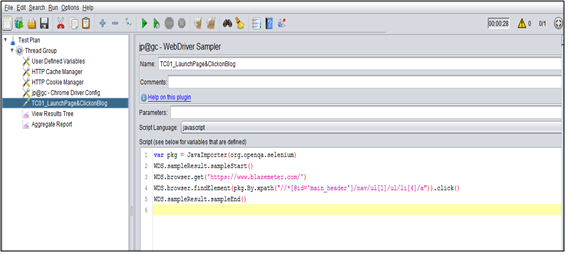
Let us find out how to create Selenium scripts in JMeter to capture the ‘Page Load Time.’ Firstly, we need to have a basic understanding of Java programming in order to create JMeter performance scripts using Selenium. Below is a compact web driver sampler script which navigates to a URL and performs an event click.
var pkg = JavaImporter(org.openqa.selenium)
WDS.sampleResult.sampleStart()
// Starts calculating the time
WDS.browser.get('https://www.blazemeter.com/')
//To navigate to an URL
WDS.browser.findElement(pkg.By.xpath("//*[@id='main_header']/nav/ul[1]/ul/li[4]/a")).click()
WDS.sampleResult.sampleEnd()
//Ends the time stamp
This use case calculates the page load time for a blog site URL by clicking on the blog module. Additionally, it also calculates the page load time. Below screenshot shows the Web Driver sampler code which navigates to a URL and clicks on a module.
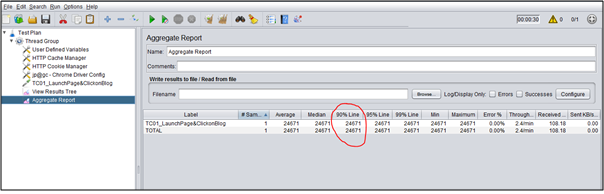
If you observe, complete page load time has been captured in an aggregate report below. The highlighted field shows that the activities took around 24.67 seconds.
Benefits
We have implemented this approach for a few use cases and the outcome was great.
- These reports have both server and user response times.
- Reports help the team to understand where exactly the problem lies.
- The team can work on the identified problems and provide quick-fixes rather than adopting a trial and error approach.
Limitations
Software testers should account for the below limitations while implementing this solution.
- We cannot use Selenium automation code directly in JMeter but can use only predefined selenium commands.
- Selenium tool performs an operation for a single user and single iteration.
- While most of the testers have knowledge of JMeter scripts, in this scenario, we need knowledge on Java and Selenium.
Using Selenium tests in JMeter is relatively easy and lets you redeploy your Selenium functional testing for load testing and run tests on our infrastructure. Using WebDriver however, can limit your capacity to scale due to its high usage of CPU. It is recommended assembling Selenium tests with JMeter tests to perform better load timing.
Evoke’s – QA and Software Testing Services
We provide world-class quality assurance and software testing services that are designed with a greater focus on quality, performance, and security. Our mature software testing frameworks coupled with smart testing methodologies enable enterprises to meet the expectations of both business users and customers. To learn more about our leading-edge software testing services contact us today.
Author
 |
Uday Kumar Amanaganti works as a Software Test Engineer in Evoke Technologies and holds a strong foothold in Performance Testing with various performance and debugging tools like JMeter, Load Runner, and Fiddler. In his free time, he likes to explore the latest software testing tools and technologies. |


2 Comments
Thank Uda for the info,
my thread group got failed with below error after i have provided the compatable JAR in JMeter-bin
ava.lang.IllegalStateException: The driver executable does not exist: C:\performa\jmeter\bin
at com.google.common.base.Preconditions.checkState(Preconditions.java:585) ~[guava-25.0-jre.jar:?]
at org.openqa.selenium.remote.service.DriverService.checkExecutable(DriverService.java:137) ~[selenium-remote-driver-3.14.0.jar:?]
Hi Murthy,
Thanks for the comment.
Seems you are missing chrome driver exe file, please download chromedriver.exe file and provide the path in JMeter – Chrome Driver Config. it will work fine.